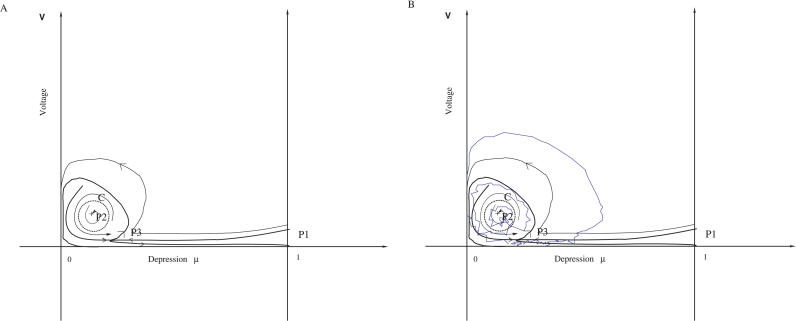
Figure 1. Schematic Representation of the Phase Space (μ,V).
(A) The depression μ is plotted on the x-axis, while the variable V is on the y-axis (for the schematic representation, no scale is given). The recurrent sets are the attractor points P 1 (the Down state), the saddle point P 3 , and the attractor P 2 (the Up state), separated by an unstable limit cycle C (dashed line). The region inside the unstable limit cycle is the basin of attraction of P 2. By definition, it is the Up state. For a specific value of the parameter, an homoclinic curve can appear. The unstable branch of the separatrix starting from P 3 terminates inside the basin of attraction of the Down state. The noise drives the dynamics beyond the separatrices (lines with arrow converging to P 3) but a second transition is necessary for a stochastic trajectory to enter inside the Up state delimited by C. However a single noise transition is enough to destabilize the dynamics from the Up to the Down state.
(B) Example of a trajectory in the phase space.

