
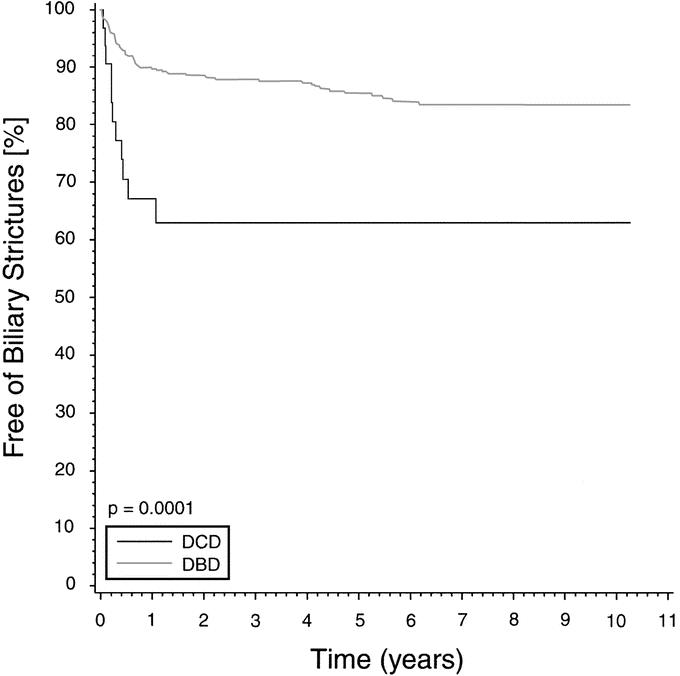
FIGURE 1. Overall biliary stricture rate in liver transplantation after DCD and DBD donation. Kaplan-Meier curves depict the percent free of strictures over time.
Official websites use .gov
A
.gov website belongs to an official
government organization in the United States.
Secure .gov websites use HTTPS
A lock (
) or https:// means you've safely
connected to the .gov website. Share sensitive
information only on official, secure websites.
FIGURE 1. Overall biliary stricture rate in liver transplantation after DCD and DBD donation. Kaplan-Meier curves depict the percent free of strictures over time.