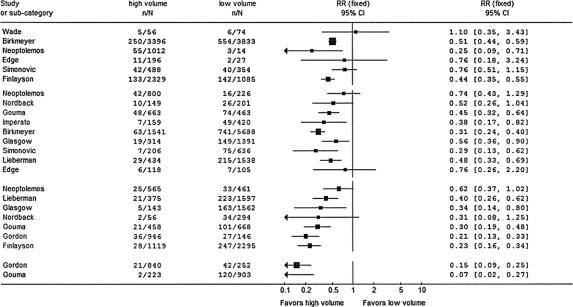
FIGURE 1. Forest plot. Individual relative risk (RR) for hospital or 30-day mortality after pancreatic resection in high-volume hospitals versus low-volume hospitals. Categories I to IV represent the cutoff values for the volumes 2, 5, 10, and 20 procedures per year. N, total number of operated patients; n, number of deaths; RR, relative risk

An official website of the United States government
Here's how you know
Official websites use .gov
A
.gov website belongs to an official
government organization in the United States.
Secure .gov websites use HTTPS
A lock (
) or https:// means you've safely
connected to the .gov website. Share sensitive
information only on official, secure websites.
