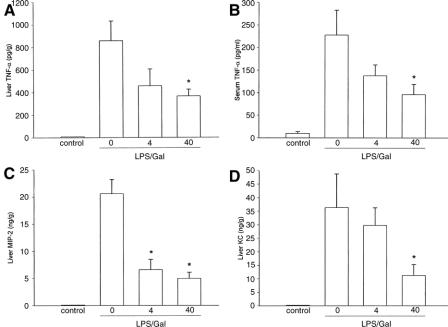
FIGURE 7. Levels of tumor necrosis factor-α (TNF-α) in the liver (A), serum (B), and hepatic (C) levels of macrophage inflammatory protein-2 (MIP-2) and cytokine-induced neutrophil chemoattractant (KC) (D) 6 hours after treatment with a combination of lipopolysaccharide (LPS, 10 μg) and d-galactosamine (Gal, 18 mg). Negative control animals received only PBS and vehicle (Control). Mice were pretreated i.p. with vehicle (0) or an inhibitor of p38 MAPK (SB 239063, 4 and 40 mg/kg). Data represent mean ± SEM *P < 0.05 versus vehicle (0); and n = 5–8.

An official website of the United States government
Here's how you know
Official websites use .gov
A
.gov website belongs to an official
government organization in the United States.
Secure .gov websites use HTTPS
A lock (
) or https:// means you've safely
connected to the .gov website. Share sensitive
information only on official, secure websites.
