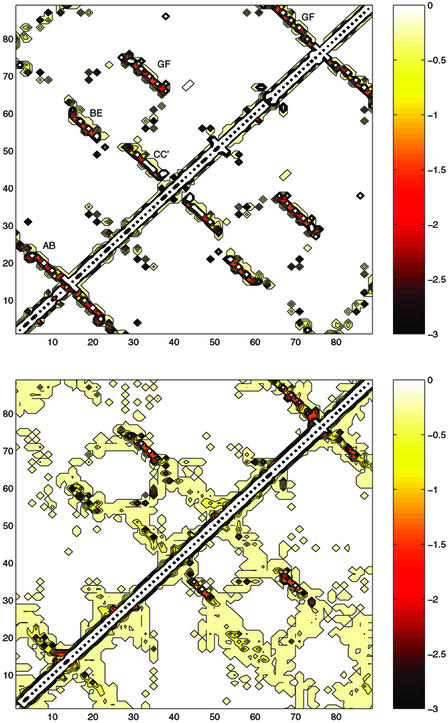
Figure 5.
Energy maps in the native state (Upper) and the TSE (Lower), both calculated with largest number of φexp available (upper part of the matrix) and with only the four key residues (lower part of the matrix). This is a graphical representation of interaction matrices where the element I, J, is the EEF1 interaction between residues I and J. The scale of the energies is indicated; all values are in kcal/mol.

