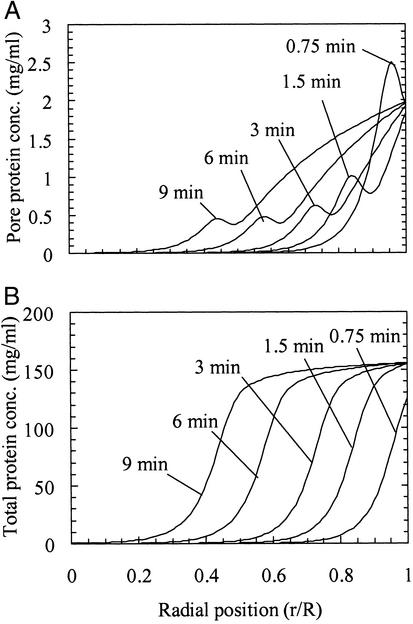
Figure 7.
Calculated concentration profiles for Da = 200 and R = 50 μm. (A) Pore concentration. The calculations show an overshoot in the pore concentration at the front. The finite adsorption rate causes radial gradients in adsorbed protein concentration to be gradual, thus causing the electrophoretic contribution to transport to be significant for the pore protein. (B) Total protein concentration. No overshoot is predicted, because of the near-rectangular adsorption isotherm.

