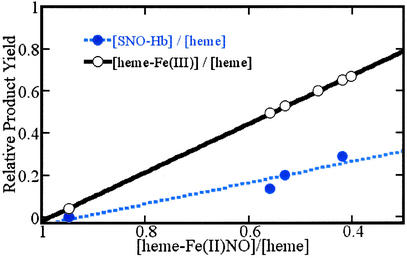
Figure 5.
Conversion of heme-Fe(II)NO centers to heme-Fe(III) and SNO-Hb on exposure of Hb(NO)4 to ferricyanide. Samples of the reaction medium are withdrawn at various points in the course of the reaction for analysis of the amounts of heme-Fe(II)NO, heme-Fe(III), and nitrosothiol, relative to the total heme in the medium. ○, Heme-Fe(III) production compared to heme-Fe(II)NO depletion; solid line, the best linear fit to these experimental points (slope −1.15 ± 0.01; intercept = 1.14 ± 0.01; R = 0.9998) indicative of a one-to-one conversion of heme-Fe(II)NO to heme-Fe(III). ●, Experimental S-nitrosothiol production compared to heme-Fe(II)NO depletion; dashed line, the best linear fit to these experimental points (slope −0.50 ± 0.11; intercept 0.46 ± 0.07; R = 0.96). Product analysis was carried out as described in the text.

