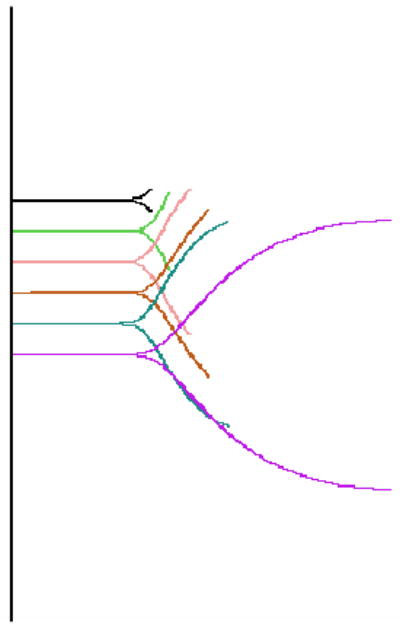
Figure 4.

TEG® segments representing sequential time points when the whole blood sample was stopped at various time intervals. The first derivative (velocity) of each segment determines the total thrombus generation, TTG, of that segment, while the corresponding TAT segment determines total TAT generation.
