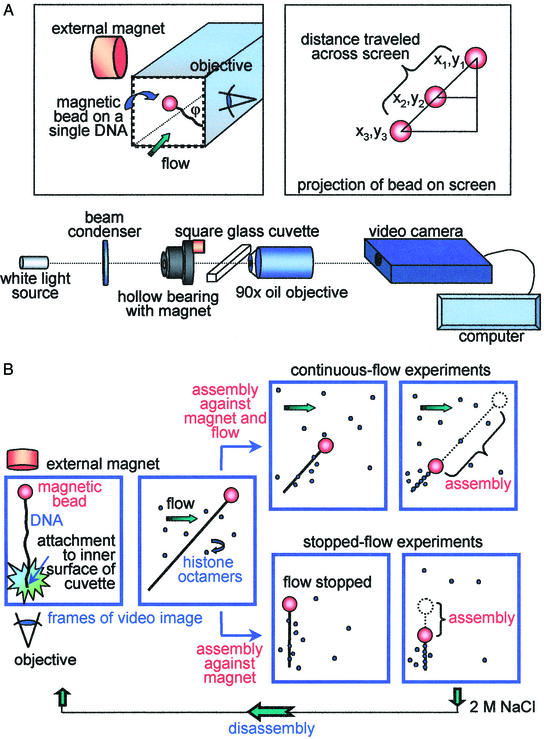
Figure 1.
(A) Schematic of the instrumental set-up (not to scale). (Upper Left) Blow-up of the cuvette with the magnetic bead attached to the side of the cuvette. (Upper Right) Schematic explaining the calculation of the distance traveled by the bead across the video screen. The x and y coordinates of the bead position on each successive video frame were determined with respect to the x and y coordinates of the bead at the end of the assembly process (when the bead stopped moving). Note that the DNA tether (Upper Left) is not normal to the wall of the cuvette because of the position of the external magnet; i.e., the z direction is out of the plane of the video frame. The magnet was placed this way to allow visualization of the bead movement in both x and y directions. (B) Schematic of the two experimental approaches: continuous-flow and stopped-flow experiments (not to scale). First frame, the bead position at the start of the experiment; second frame, the histones and NAP-1 flowed in and assembly started.

