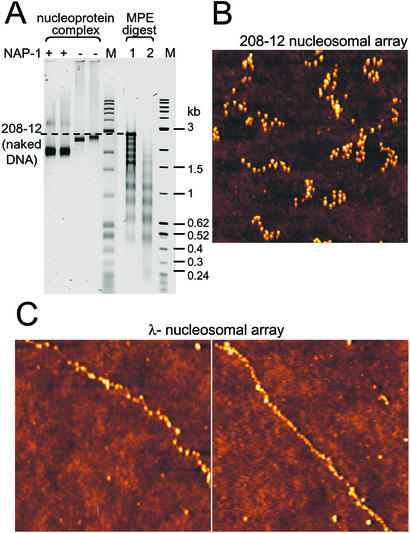
Figure 2.
Biochemical characterization and AFM imaging of NAP-1 assembled nucleosomal arrays. (A) Electrophoretic mobility and MPE analysis of NAP-1 assembled nucleosomal arrays by using the 208-12 DNA as reconstitution substrate. M lanes contain size markers (1-kb DNA ladder and pBR322/MspI). Note that the NAP-1 assembled deoxyribonucleoprotein complexes migrate faster in the 1.5% agarose gel (first two lanes, two different preparations) than those assembled without NAP-1 (third and fourth lanes, two different preparations). MPE hydrolysis (10 min of 3 μm of MPE in lane 1 and 6 μm of MPE in lane 2) of the NAP-1 assembled 208-12 nucleosomal arrays produces nucleosomal ladders. (B) AFM image of NAP-1 assembled 208-12 nucleosomal arrays. The fibers were fixed with glutaraldehyde, deposited on glass from 10 mM triethanolamine⋅HCl/0.5 mM EDTA, pH 7.5, and imaged in air on a MAC mode AFM, as described (9). (C) AFM images of NAP-1 assembled λ-nucleosomal arrays. Dimensions of AFM images are 1,000 nm × 1,000 nm for both B and C Left and 2,000 nm × 2,000 nm for C Right. Heights are indicated in color on a scale from 0 to 5 nm, with the glass surface indicated in dark brown and the nucleosomes in ever-lighter shades of color.

