Figure 6.
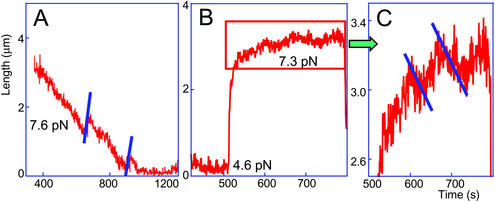
(A) Enlargement of a portion of an assembly curve (recorded at 7.6 pN) to indicate the abrupt lengthening of the nascent nucleosomal chain, reflecting opening (nucleosome disassembly) events. Note that the disassembly jumps occur at the same rates (parallel lines) and are of approximately the same amplitude. (B) A portion of a curve from a cycling experiment: a nucleosomal array was first assembled to completion at intermediate (4.6 pN) force and then subjected to a higher (7.3 pN) force. (C) Enlargement of the boxed portion of the curve in B. The force applied in C was similar to that applied in A, the difference between the two experiments being that, in A, the entire assembly process was done continuously at one and the same force, whereas in B and C, the force was cycled. Note the changes (indicated by parallel lines) in the slope of the curve, reflecting the existing dynamic equilibrium between assembly and disassembly.

