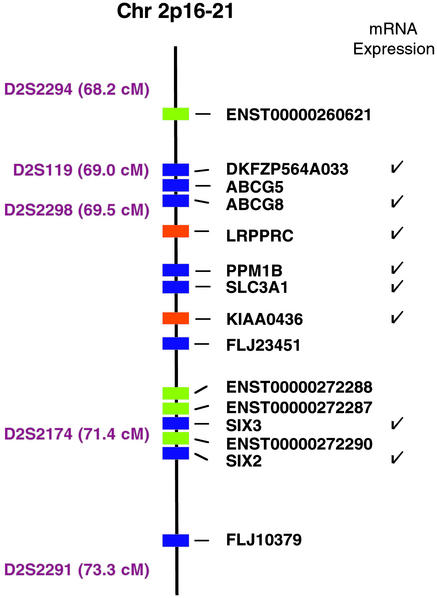
Figure 2.
Physical map of the LSFC candidate region (Human Genome, August 2001, chr2:46994838–48992238). Microsatellite markers and genetic distances are shown to the left of the chromosome map. Genes with varying levels of annotation support are shown with different colors (RefSeq gene, blue; Ensembl gene, green; human mRNA, orange). An additional 15 computationally predicted genes lie within this region but are not shown. Genes represented in mRNA expression sets are indicated with a check to the right of the gene names.

