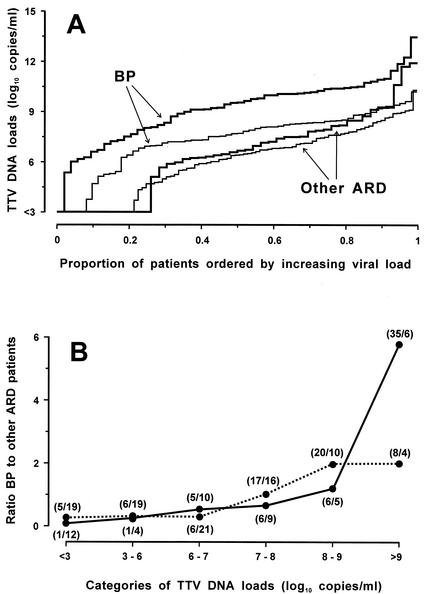
FIG. 3.
TTV loads in the 151 plasma and 100 nasal fluid specimens from children with ARD, subdivided by respiratory disease (BP versus other ARD). (A) Thick and thin lines represent nasal fluid and plasma samples, respectively. Most steps represent single patients. TTV loads in nasal fluid and plasma differed significantly between patients with BP and other ARD at P < 0.00001 and at P < 0.00001, respectively (Wilcoxon test). (B) Results stratified based on the TTV load in plasma (dotted line) and nasal fluid (continuous line). Each point represents the ratio between the number of patients with BP and the number of patients with other ARD. The numbers in parentheses are the number of patients with BP/the number of patients with other ARD.

