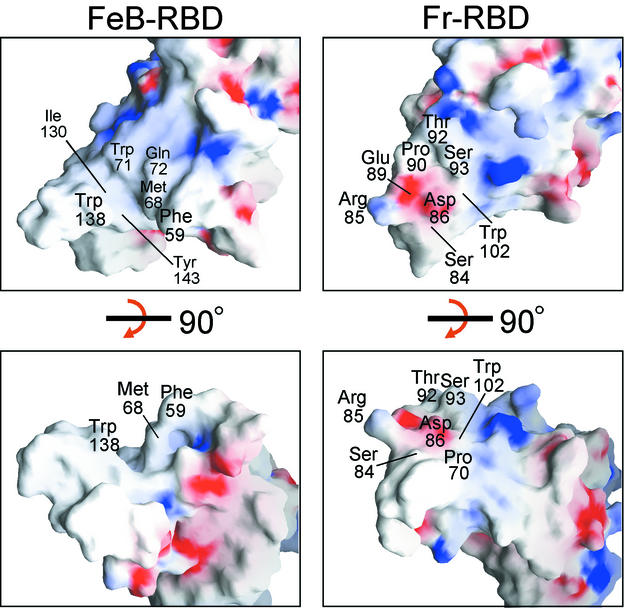
FIG. 4.
Surface contours and charge density of FeB-RBD (left panels) compared to Fr-RBD (right panels). In the top panels, the RBDs are viewed in the same orientation as in Fig. 2B. The structures were then rotated 90° around the x axis to obtain the view in the bottom panels, which corresponds to Fig. 2C. Regions of basic potential (>10.6 kBT/e for FeB-RBD, >9.5 kBT/e for Fr-RBD) are in blue; acidic regions (<−9.8 kBT/e for FeB-RBD, −11.2 kBT/e for Fr-RBD) are in red. Some surface-exposed amino acids in the variable subdomains are labeled. The figure was generated by using GRASP (35).

