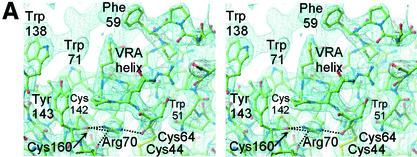
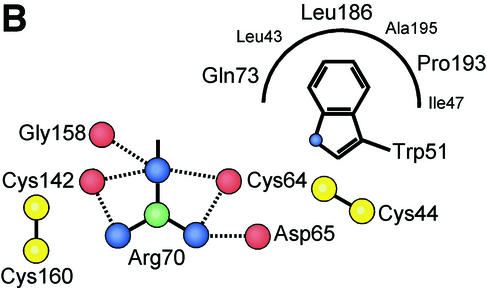
FIG. 5.
VRA helix and the interface between the receptor-binding surface and the conserved interaction with the β-scaffold. (A) A 2Fo-Fc electron density map calculated with CNS (9) is displayed at 1.2σ around the final model of FeB-RBD. Dotted lines indicate interactions between the guanidino group of Arg70 and backbone carbonyl groups in the vicinity. Unmodeled electron density toward the upper left corresponds to the region containing Pro68 and Phe59 in a symmetry-related molecule. (B) Schematic diagram of the interactions made by the four consensus residues, Trp51, Cys64, Arg70, and Cys142, at the interface between the variable subdomain and the conserved scaffold of FeB-RBD. The view is from the top of panel A. Interactions are shown in projection and are not to scale. Red balls represent backbone carbonyl oxygen atoms, yellow balls are cysteine sulfur atoms, blue balls are side chain nitrogen atoms, and green balls are side chain carbon atoms. Although the side chains of the Arg70 residue in each of the two molecules of the asymmetric unit of FeB-RBD superpose, they make slightly different contacts with adjacent residues. It is not clear whether these differences reflect real alternatives or limitations of the diffraction data. The composite of all interactions is shown in this figure. The corresponding residues in Fr-RBD are marked in Fig. 3.


