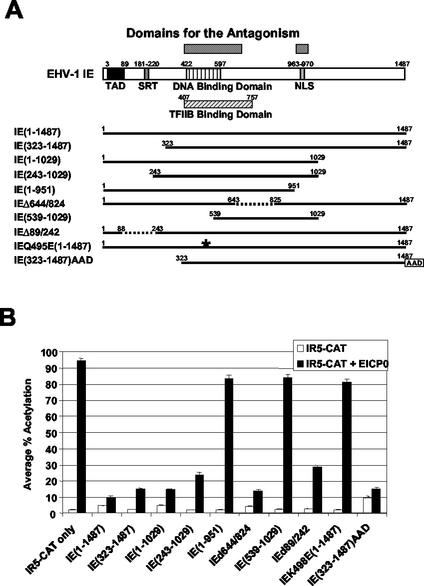
FIG. 2.
Domains essential for the antagonism between the IE and EICP0 proteins. (A) Schematic diagram of the deletion mutants of the IE protein. The top diagram represents the 1,487-aa IE protein of EHV-1. TAD, acidic transcriptional activation domain; SRT, serine-rich tract. The numbers refer to the number of amino acids from the N terminus of each protein. The asterisk indicates a point mutation in the DNA-binding domain of the IE protein. (B) CAT assays with the IE deletion mutants. L-M cells were transfected with 2.0 pmol of reporter plasmid (pIR5-CAT) and 0.3 pmol of effector plasmids. Each transfection was performed in triplicate. The data are averages and are representative of several independent experiments. Error bars show standard deviations.

