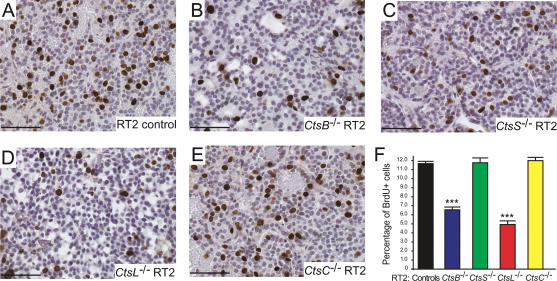
Figure 4.
Mice mutant for cathepsins B or L, but not S and C, show decreases in tumor cell proliferation. BrdU staining was used to visualize proliferating cells in tumors from control RT2 (A), CtsB−/− RT2 (B), CtsS−/− RT2 (C), CtsL−/− RT2 (D), and CtsC−/− RT2 (E) mice, stained under identical conditions. Positive cells are stained in brown, and hematoxylin (blue) is used as a counterstain. Representative images from each genotype are shown. (F) The percentage of proliferating (BrdU+) cells was calculated from several fields per tumor in each mouse analyzed, and the means and standard errors are shown for each genotype. The total numbers of fields scored are as follows: RT2 controls: 255 fields from 19 mice; CtsB−/− RT2: 81 fields from seven mice; CtsS−/− RT2: 51 fields from five mice; CtsL−/− RT2: 33 fields from three mice; CtsC−/− RT2: 69 fields from five mice. The “controls” column corresponds to both +/+ and +/− RT2 littermates generated from the four cathepsin mutant/RT2 crosses. The means and standard errors are shown, and P values were calculated by comparison to the RT2 littermate control group using the Wilcoxon t-test; (***) P value of <0.0001. Bars, 50 μm.

