Figure 5.
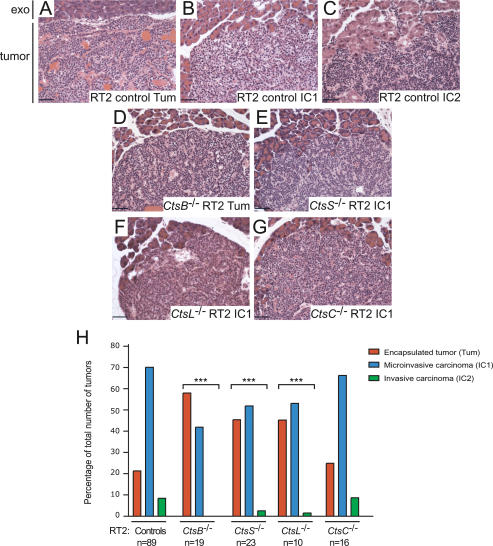
Deletion of cathepsins B, L, or S, but not C, impairs tumor invasion. H&E staining was used to grade tumors from cathepsin knockout RT2 mice and RT2 littermate controls. Tumors in RT2 mice can be divided into three different classes, as shown in representative H&E images from control RT2 mice: (A) Encapsulated tumors (Tum). (B) Microinvasive carcinomas (IC1). (C) Invasive carcinomas (IC2). Representative images for the predominant grade of tumors in cathepsin knockout/RT2 mice are indicated. (D) CtsB−/− RT2: Tum. (E) CtsS−/− RT2: IC1. (F) CtsL−/− RT2: IC1. (G) CtsC−/− RT2: IC1. In all H&E panels, the normal exocrine tissue (exo) is shown at the top of the image for comparison to the tumor below. (H) Graph showing the relative proportions of encapsulated, microinvasive, and invasive carcinomas in RT2 controls versus the different cathepsin knockout/RT2 mice at 13.5 wk of age. The “controls” column corresponds to both +/+ and +/− RT2 littermates generated from the four cathepsin mutant/RT2 crosses. The total numbers of tumors scored are as follows: controls: 1416 tumors from 89 mice; CtsB−/− RT2: 269 tumors from 19 mice; CtsS−/− RT2: 277 tumors from 23 mice; CtsL/- RT2: 64 tumors from 10 mice; CtsC−/− RT2: 288 tumors from 16 mice. The distribution of tumor types in the control group was compared with the distribution of tumors in the other four groups using a cumulative logit model with generalized estimating equations to correct for correlations within individual mice. (***) P value of <0.0001 compared with the controls group using this test. Bars, 50 μm.

