Figure 8.
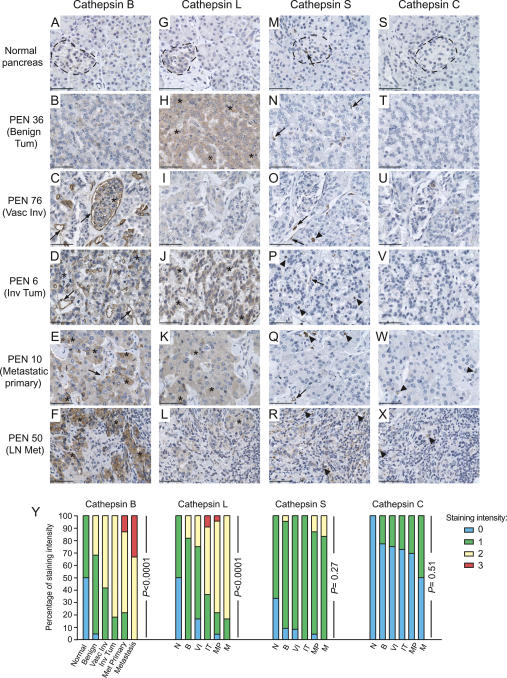
Increased levels of cathepsins B and L are positively associated with tumor progression in human PEN lesions and associated metastases. A TMA was constructed from a panel of human PEN and normal pancreas tissues. (A–X) Tissue arrays were stained with antibodies against cathepsins B, L, S, and C as indicated. Cathepsin-positive cells are stained in brown, and hematoxylin (blue) was used as a counterstain. Representative images of normal human pancreas (n = 6) stained for each antibody are shown in the first row, with normal islets indicated with a dotted black line, surrounded by normal exocrine cells. Representative images for each of the tumor stages—Benign Tumor (n = 22), Vascular Invasive Tumor (n = 12), Invasive Tumor (n = 11), Metastatic Primary (n = 23), and Metastasis (n = 6)—are shown in the rows below. The PEN number corresponds to the position on the tissue array. Tumor cell staining is indicated by asterisks, endothelial cell staining by arrows, and immune cell staining by arrowheads. (Y) The cathepsin staining for each tissue specimen was scored as negative (0) or positive [three levels: weak (1); moderate (2); strong (3)] and graphed as the percentage of staining intensity for each stage. For each cathepsin, an overall test of differences among any of the groups (normal and tumor) was performed. An exact version of Mantel Haenszel’s test for trend was performed to look for differences in staining in each tumor group compared with the normal controls and to calculate P values, which are shown next to each data set. Bars, 50 μm.

