
Fig. 1.
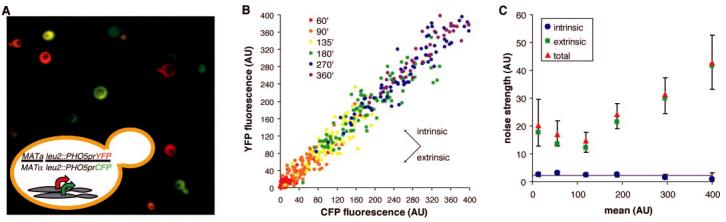
Separation of intrinsic and extrinsic noise for the PHO5 promoter. (A) A false-color overlay of YFP (red) and CFP (green) fluorescence micrographs from a diploid yeast strain that expresses YFP and CFP from identical promoters at homologous loci, as diagrammed in the inset. (B) Scatter plots showing CFP and YFP values for each cell (solid circles) during a time course of PHO5 induction by phosphate starvation. Populations from different time points (in minutes) are indicated with different colors. Extrinsic noise is manifested as scatter along the diagonal and intrinsic noise as scatter perpendicular to the diagonal. AU, arbitrary units of fluorescence. (C) Total, extrinsic, and intrinsic noise strength as functions of population mean for (B). The solid line represents expectations for a single stochastic process, and error bars represent bootstrap values (6).