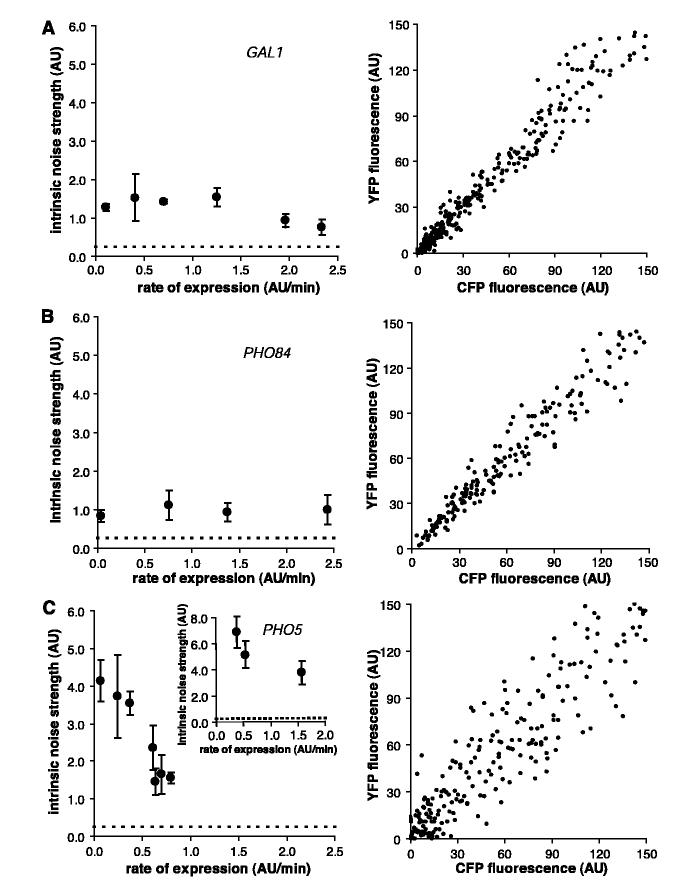
Fig. 2.
(A) Intrinsic noise strength as a function of rate of expression for GAL1 (left) and a scatter plot of GAL1-expressing cells at maximal induction (right). To produce different rates of expression, cells were induced with different galactose concentrations. (B) Intrinsic noise strength as a function of rate of expression for PHO84 and a scatter plot of PHO84-expressing cells at maximal induction. Cells were induced with different phosphate concentrations. (C) Intrinsic noise strength as a function of rate of expression for PHO5 and a scatter plot of PHO5-expressing cells at the maximal level of induction by phosphate starvation. Cells were induced with various levels of chemical inhibition of an upstream kinase (left) or with various organic phosphate concentrations (inset). The dashed line indicates the intrinsic error of measurement, and error bars represent standard deviations. Scatter plots contain cells from multiple time points.

