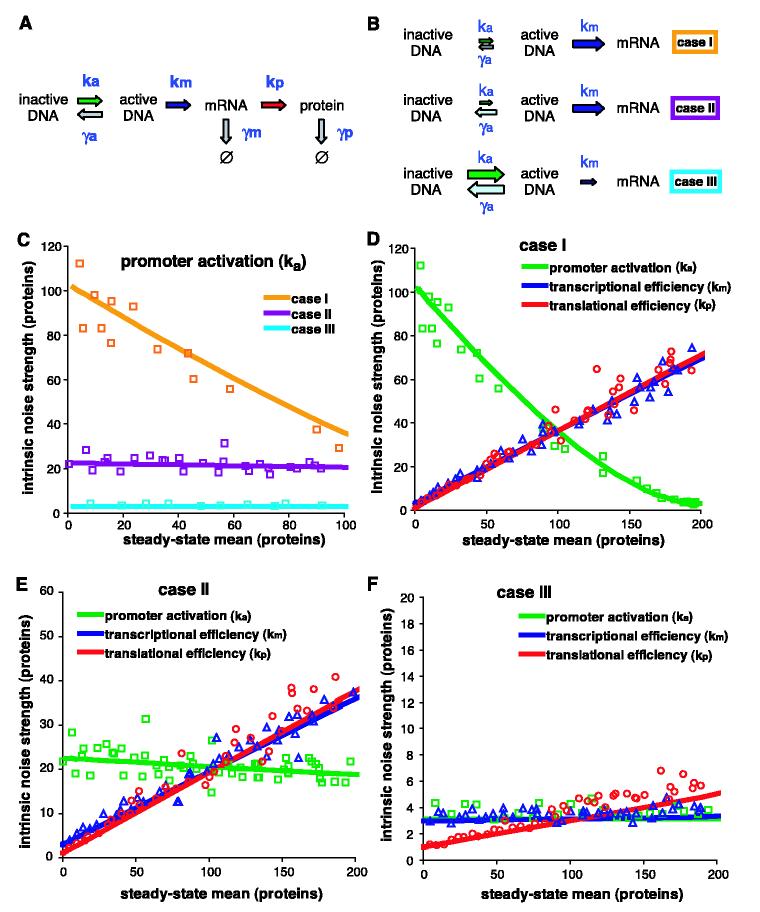
Fig. 3.
General stochastic model of gene activation and expression. (A) Schematic of reactions with stochastic rate constants of production (k) and degradation (γ). Ø indicates the null product of degradation. a, active DNA; m, mRNA; p, protein. (B) Three cases, where the relative size of the arrows indicates the relative magnitude of the constants within each case. (C) The effect on intrinsic noise strength of changing the promoter activation rate to change the steady-state mean of expression for case I (orange □), case II (violet □), and case III (cyan □). (D to F) The effect on intrinsic noise strength of changing promoter activation (green □), transcriptional efficiency (red ○), and translational efficiency (purple △) to change the steady-state mean of expression for (D) case I, (E) case II, and (F) case III. For (C) to (F), the solid lines display the predicted values, and the open symbols are averages from stochastic simulations (6).

