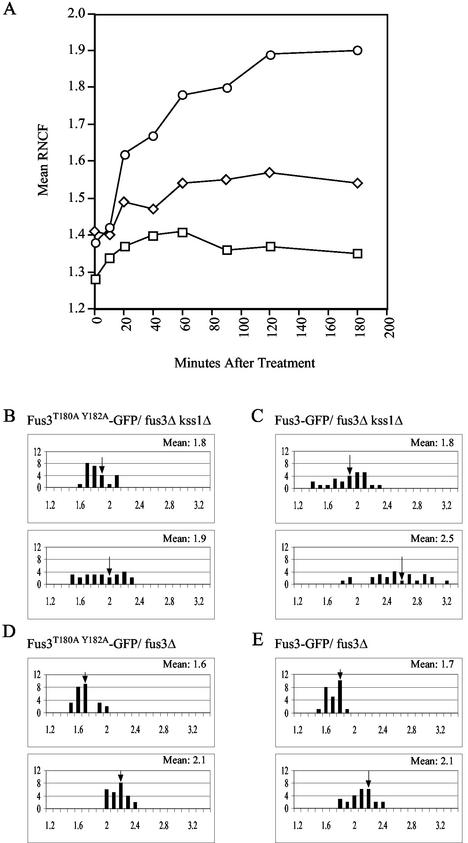
FIG. 1.
Pheromone induces nuclear accumulation of Fus3. Strains of the indicated genotype were transformed with the indicated GFP reporters and grown to mid-log phase. The cultures were then split and grown with or without the addition of 12 nM α-factor. Images were acquired from the untreated cultures and at various times after the addition of pheromone. The RNCF values were determined as described in Materials and Methods. In panels B to E, distributions of RNCF values are represented in histograms. The number of cells (y axis) are plotted as a function of the RNCF values (x axis). In each panel, the untreated cells are represented in the top histogram, and the cells treated for 3 h with pheromoneare represented in the bottom histogram. Arrows indicate the mean RNCF for each of the sampled populations. (A) Time course experiment showing Fus3-GFP localization in wild-type cells (○), cells overexpressing Gpa1E364K (□), and cells overexpressing Msg5 (⋄). Mean RNCF values were determined before and 10, 20, 40, 60, 90, 120, and 180 min after pheromone treatment; (B) Fus3T180A Y182A-GFP localization in fus3Δ kss1Δ cells; (C) Fus3-GFP localization in fus3Δ kss1Δ cells; (D) Fus3T180A Y182A-GFP localization in fus3Δ cells; (E) Fus3-GFP localization in fus3Δ cells.

