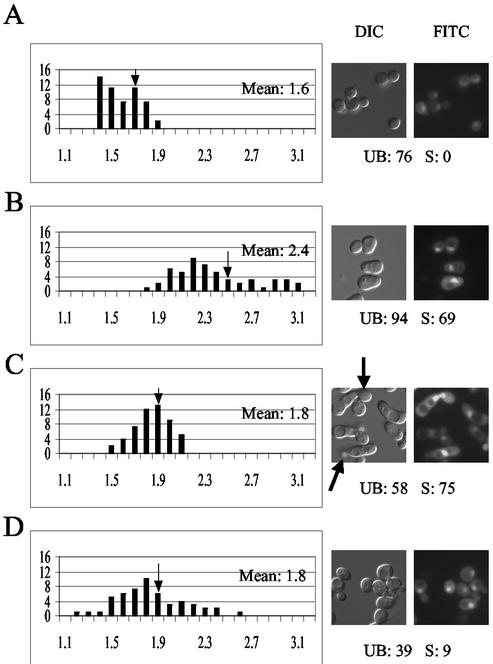
FIG. 2.
Adaptation to pheromone is correlated with a decrease in nuclear Fus3. Wild-type cells transformed with Fus3-GFP were grown to mid-log phase and treated with 6 nM α-factor. Images were acquired at 0, 3, 6, and 27 h. After 24 h in the original medium, the treated culture was resuspended in fresh medium containing 6 nM α-factor, and images were taken for analysis 3 h later. RNCF values were determined as described in Materials and Methods, and the distribution of values represented in histograms. The number of cells (y axis) are plotted as a function of the RNCF values (x axis). The arrows on the histograms indicate the mean RNCF for each of the sampled populations. The arrows on the DIC images indicate cells that have responded and recovered (budded shmoos). “UB” refers to the percentage of unbudded cells. “S” refers to the percentage of shmooing cells. (A) Vegetative cells; (B) cells 3 h after treatment; (C) cells 6 h after treatment; (D) cells 27 h after first treatment and 3 h after the second treatment.

