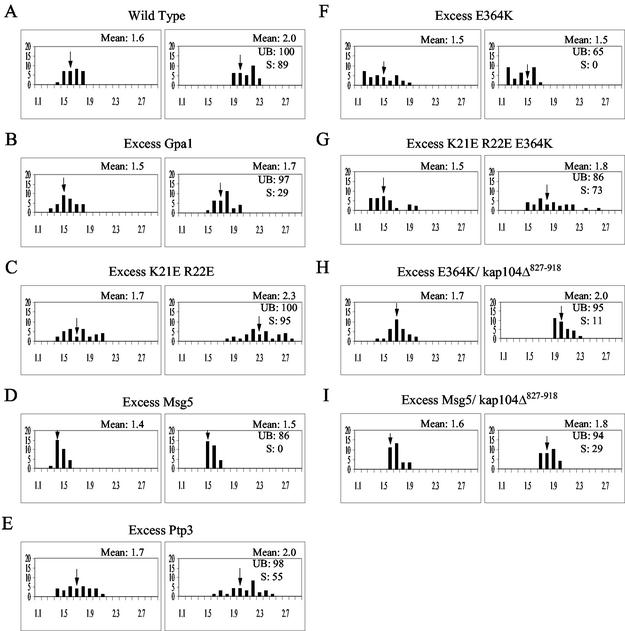
FIG. 3.
Gpa1 and Msg5 inhibit the pheromone-induced accumulation of Fus3 in the nucleus. MATa strains of the indicated genotype were transformed with the Fus3-GFP reporter and grown to mid-log phase in galactose medium (GAL1 promoter on). The cultures were then split and grown with or without the addition of 18 nM α-factor. Images were acquired from the untreated cultures and from the treated cultures 3 h after the addition of pheromone. The RNCF values were determined as described in Materials and Methods, and the distribution of values is represented in histograms. The number of cells (y axis) are plotted as a function of the RNCF values (x axis). In each panel, the untreated cells are represented in the histogram on the left, and the treated cells are represented in the histogram on the right. Arrows indicate the mean RNCF for each of the sampled populations. UB refers to the percentage of unbudded cells; S refers to the percentage of shmooing cells. (A) Wild-type cells; (B) GAL1EG28-GPA1 cells; (C) GAL1EG28-GPA1K21E R22 cells; (D) GAL1-MSG5 cells; (E) GAL1-PTP3 cells; (F) GAL1EG28-GPA1E364K cells; (G) GAL1EG28-GPA1K21E R22E E364K cells; (H) GAL1EG28-GPA1E364K kap104Δ::HIS YCplac111/kap104Δ827-918 cells; (I) YCplac22/GAL1-MSG5 kap104Δ::HIS YCplac111/kap104Δ827-918 cells.

