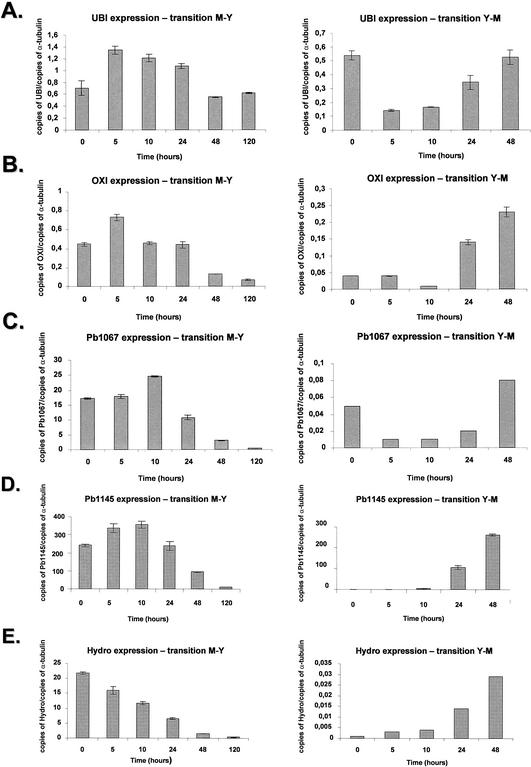
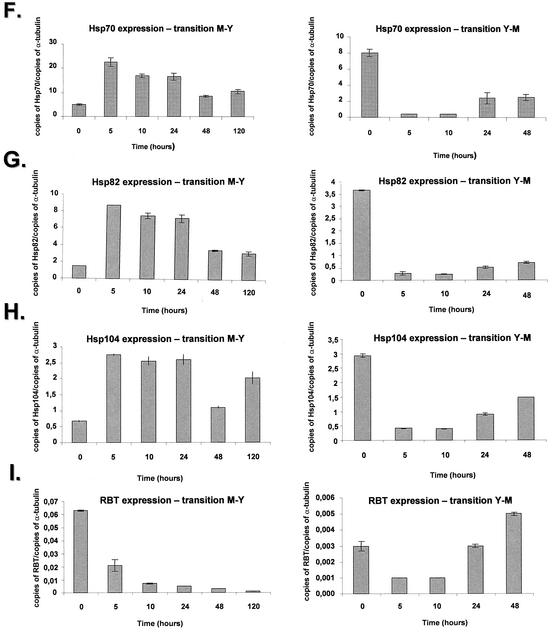
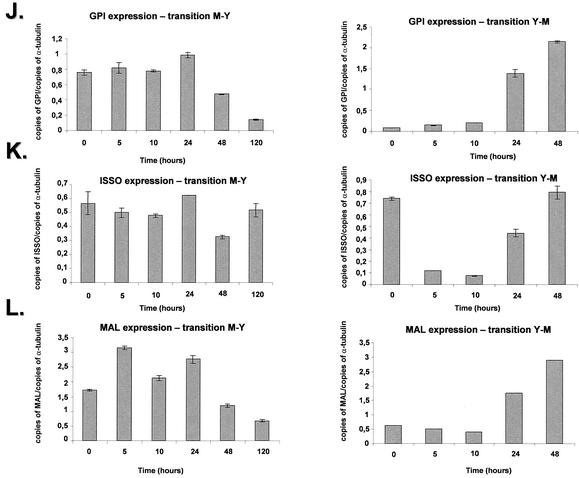
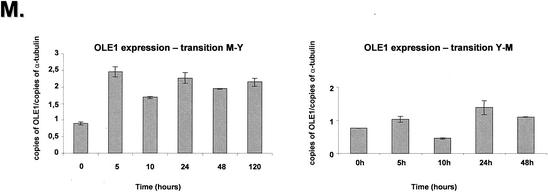
FIG. 4.
Quantitation of the mRNA expression of selected genes of P. brasiliensis during the M-Y-M transition. The measured quantity of each P. brasiliensis gene mRNA in each of the treated samples was normalized by using the CT values obtained for the α-tubulin RNA amplifications run in the same plate. The relative quantitation of each P. brasiliensis gene and α-tubulin gene expression was determined by a standard curve (i.e., Ct values plotted against the logarithm of the DNA copy number). The values represent the number of copies of the cDNAs of each P. brasiliensis gene divided by the number of copies of the cDNAs of the α-tubulin gene. The left and right panels represent the M-Y and the Y-M transitions, respectively. (A) UBI gene, ubiquitin; (B) OXI gene, alternative oxidase; (C) contig Pb1067; (D) contig Pb1145; (E) Hydro gene, hydrophobin gene; (F) HSP70 gene; (G) HSP82 gene; (H) HSP104 gene; (I) RBT gene; (J) GPI gene; (K) ISSO gene, isocitrate lyase; (L) MAL gene, malate dehydrogenase; (M) OLE1 gene, delta-9-desaturase. The results are the averages of three repetitions.


