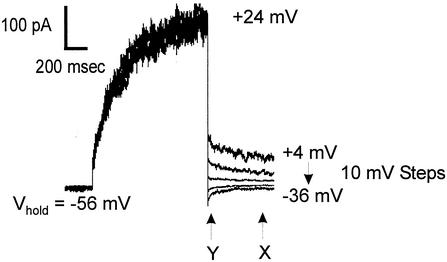
FIG. 4.
Measurements of reversal potentials (Erev) of NcTOKA whole-cell currents. Tail currents resulted from a voltage step to +24 mV, followed by steps back to pulses ranging from +4 mV to −36 mV in 10-mV steps. The holding voltage was −56 mV. SBS containing 60 mM KCl was used. The reversal potential of the tail current was determined by calculating the amplitude of the steady-state tail current (marked “X”) and 50 ms after induction of the tail current (marked “Y”). Current amplitude values measured at point Y were subtracted from those at point X and plotted against voltage. The potential at which X − Y = 0 (i.e., Erev) was determined from linear regression. Note that although capacitance currents were compensated for (see Materials and Methods), the current amplitude at Y was taken 50 ms after induction of the tail current so as to avoid contamination from any uncompensated capacitance currents.

