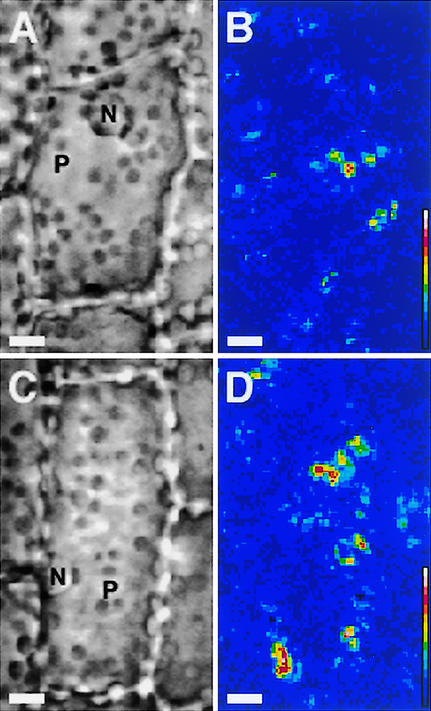
Figure 2.
Quantitative Visualization of the Photoinduction of Cytoplasmic Motility in Epidermal Cells of Vallisneria.
After dark incubation for 12 to 18 h, samples were irradiated for 4 s with white light at 0.1 W/m2 (A) or 2.0 W/m2 (C). Immediately after the termination of the irradiation, nine serial optical images were recorded sequentially under IR light at intervals of 1.0 s. Dynamic image processing was performed on each sample ([B] and [D]) as described in the legend to Figure 1. See the legend to Figure 1 for an explanation of the color scale. N, nucleus; P, plastid. Bars = 10 μm.

