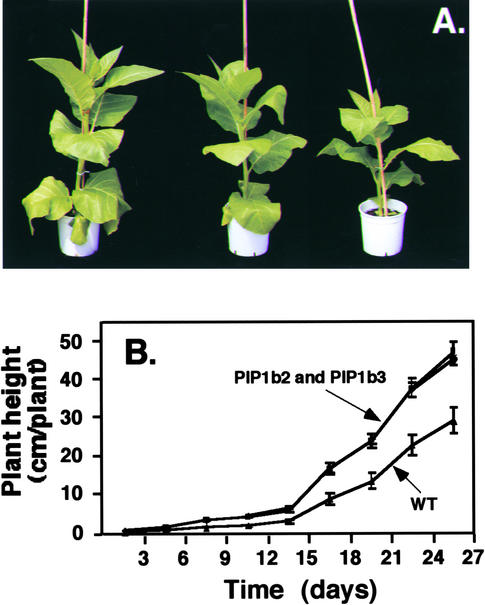
Figure 2.
Morphology of the PIP1b-Overexpressing Transgenic Tobacco Plants.
(A) Phenotypes of 65-day-old wild-type (right) and transgenic PIP1b2 (left) and PIP1b3 (center) plants.
(B) Growth rates of wild-type (WT) and transgenic PIP1b2 and PIP1b3 plants. The growth rates of PIP1b2 and PIP1b3 plants were very similar; therefore, their curves overlap. Bars represent the standard error of the mean of at least five plants per genotype.

