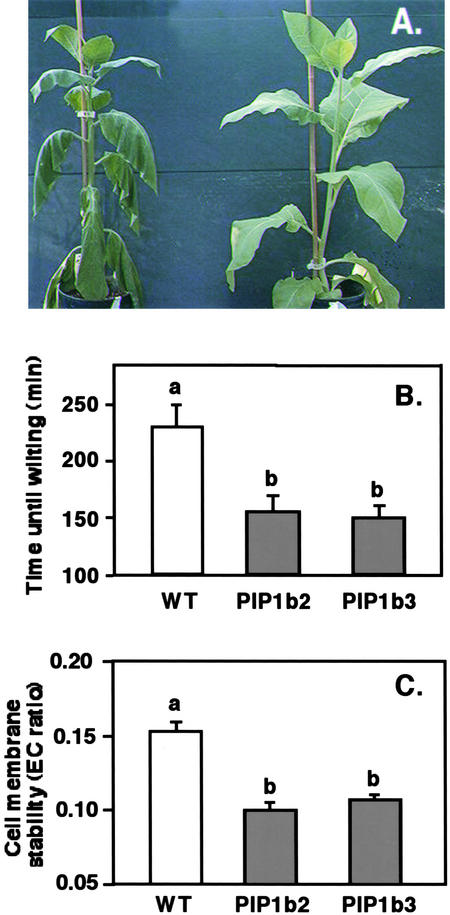
Figure 6.
Response of PIP1b Overexpression to Drought Stress.
(A) Wild-type and transgenic PIP1b2 plants were subjected to drought stress as indicated in Methods. A representative PIP1b2 plant (left) and a wild-type plant (right) were photographed on the day the first plant wilted. PIP1b3 plants also wilted significantly earlier than wild-type plants, but no photograph was taken.
(B) Time for detached leaves from regularly irrigated wild-type and PIP1b2- and PIP1b3-overexpressing plants to wilt.
(C) Cell membrane stability (EC ratio) was analyzed in wild-type and PIP1b2- and PIP1b3-overexpressing plants at the time that detached leaves of the transgenic plants wilted (leaves of wild-type plants had not yet wilted).
Bars indicate the standard errors of the means of at least five plants per genotype. Different letters above the columns indicate statistically significant differences at the 0.05 level. WT, wild type.

