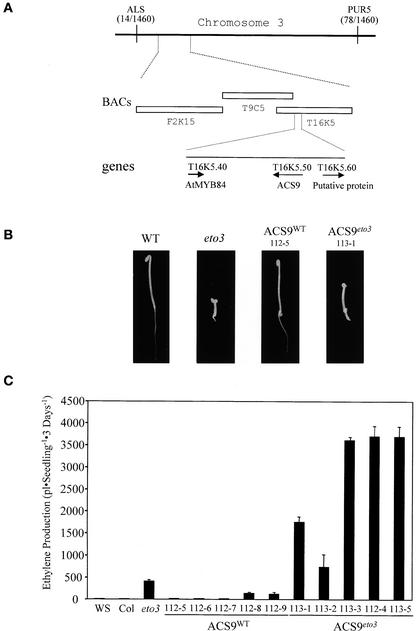
Figure 1.
Cloning of the ETO3 Gene.
(A) Physical map of the eto3 locus. A mapping population of a backcross to the Ws ecotype was used to map eto3 between the ALS and PUR5 markers on chromosome 3. A total of 730 F2 seedlings were analyzed for these markers, and the number of crossovers to each marker is indicated in parentheses. The three BACs in the region corresponding to this position are indicated, as is the position of the ACS9 gene.
(B) Seedling phenotypes of various lines. Seedlings were grown for 3 days in the dark at 23°C on Murashige and Skoog (1962) (MS) medium in the absence of exogenous ethylene, and representative seedlings were picked and photographed. Genotypes are noted at top. ACS9WT and ACS9eto3 refer to transgenic lines transformed with the wild-type (WT) and eto3 versions of the ACS9 genomic region, respectively (see Methods).
(C) Ethylene production from various etiolated seedlings. Wild-type (Ws), eto3 mutant, and independent transgenic (112-x = ACS9WT and 113-x = ACS9eto3) seedlings were grown for 3 days on MS agar in capped gas chromatography (GC) vials, and the accumulated ethylene was measured as described in Methods. Values shown are means ± sd (n = 3) of ethylene produced.

