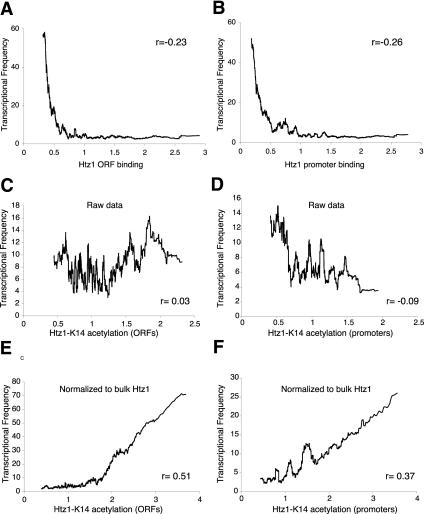
Figure 2.
Htz1 is depleted but hyperacetylated at active genes. (A,B) Moving averages (window size 100) of Htz1 binding and transcriptional frequencies at ORFs (A) and IGRs (B) are plotted relative to each other. The transcriptional frequencies for IGRs are the values for the cognate ORF. The Pearson correlation values (r) for the data sets are indicated. (C–F) Moving averages (window size 100) of Htz1-K14 acetylation at ORFs (C,E) or IGRs (D,F) are plotted relative to transcriptional frequency. The raw data are plotted in C and D; in E and F, the acetylation data have been normalized to bulk Htz1 occupancy. The Pearson correlations (r) are shown in each panel.

