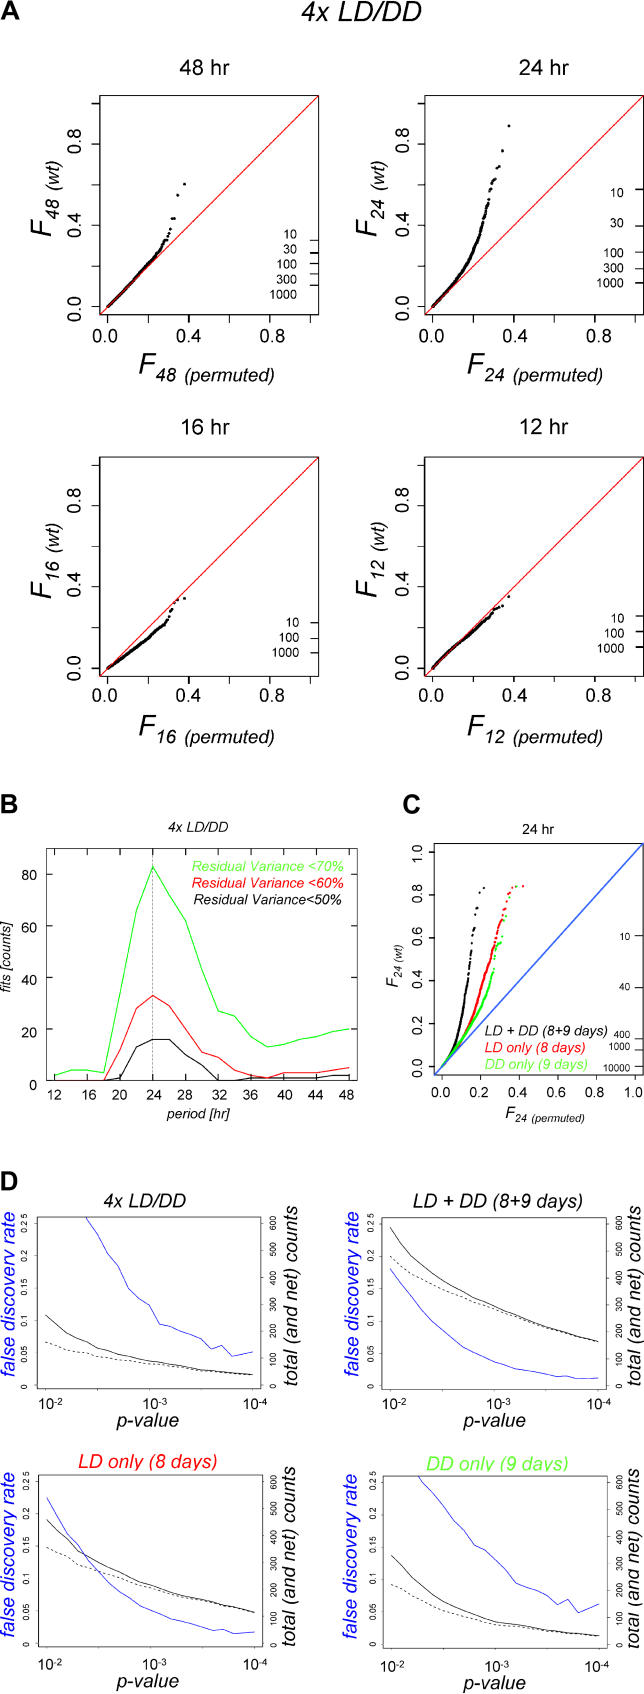
Figure 2. Genome-Wide Detection of Rhythmicity in Wild-Type LD/DD Time Series.
(A) QQ plots of spectral power (squared Fourier components) at four different periods are shown for microarray data collected from four wild-type 2-d LD/DD time course experiments. Upward deviations from the diagonals indicate global enrichment in time traces with that periodicity, while downward deviations indicate depletion. The ticks on the right show the number of profiles that exceed a certain Fourier value, emphasizing that the enrichments at 24 and 48 h are tail effects that affect no more than approximately 5% of the genome. Fourier components with 16 and 12-h periods do not show similar deviations.
(B) Strongest oscillations in the 4x LD/DD wild-type data occur for periods near 24 h. The data were fitted with cosines, and then sets of transcript profiles were chosen based on how much of their variance was due to the cosine fit. Invariably, fitting the data with 24-h period cosines produced the largest sets (as indicated by the vertical axis). Each of the three curves is the same analysis done at different levels of fit stringency, with the black curve (“Residual Variance < 50%”) being the most stringent selection.
(C) The contours of an extensive circadian expression program emerge from a comprehensive meta-analysis. The QQ plots (same format as for panel [A]) represent the 24-h spectral power distribution across all available wild-type LD and DD time-course data (this study; [15–18]; eight and nine independent days for, respectively, LD and DD). Analyses for LD data, DD data, and the combined LD + DD set are shown separately.
(D) Reliable detection of extensive daily expression programs. The diagrams show the FDR (blue line), as well as the raw and background-corrected numbers of daily transcript oscillations (total and net counts; solid and dashed black lines) as a function of the selective p-value cut-off that is applied (see Materials and Methods). Compared to the original 4× LD/DD data analysis (upper left panel) integrative analysis of the expanded LD + DD (8 + 9 d) dataset (upper right panel) is clearly more powerful. Note that the relative enrichment of 24-h periodic patterns is enhanced in the combined LD + DD data (upper right panel) set relative to the LD-only and DD-only subsets (lower left and right panels), and that substantially more daily oscillations are detected in LD versus DD conditions.

