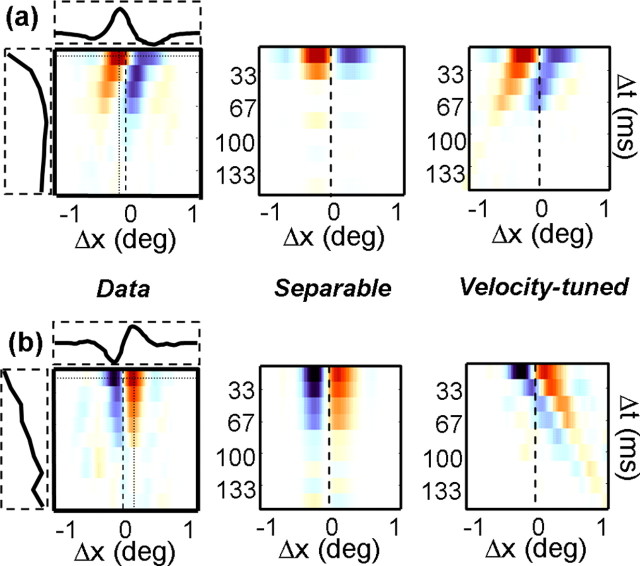
Figure 10.
A simple model of velocity tuning (Levitt et al., 1994). a, The leftmost map corresponds to the example shown in Figure 8 (bottom left). The horizontal and vertical dotted lines intersect at the point of peak facilitation, and the curves shown in the horizontal and vertical boxes correspond to response profiles taken along these lines. The middle map indicates the “separable” prediction, defined as the outer product of the horizontal and vertical curves shown next to leftmost map. The rightmost map shows the “velocity-tuned” prediction, obtained by shifting the peak spatial profile by an appropriate amount to maintain the preferred velocity (Δs/Δτ). b, Same as a but for the example neuron shown in the bottom right of Figure 8.

