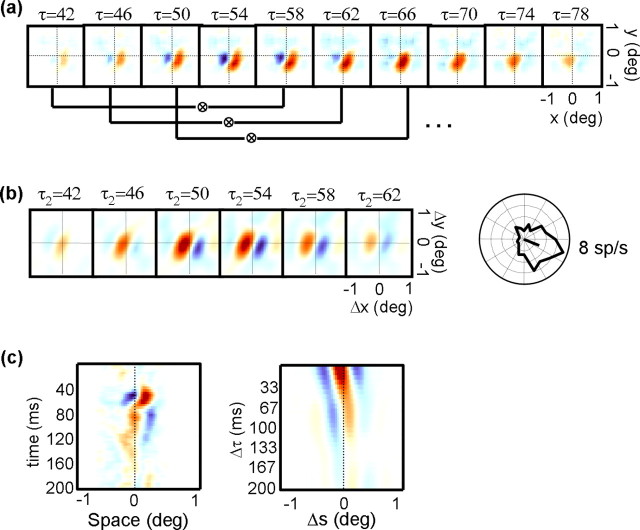
Figure 13.
a, The first-order response of a V1 simple cell. Here, each map shows the response of a neuron as a function of spatial position (x,y) at a different correlation delay (τ). The solid lines connect pairs of maps that were cross-correlated to obtain simulated second-order maps. b, Simulated displacement maps showing predicted responses as a function of spatial displacement (Δx, Δy), with correlation delay τ2 increasing from left to right. The maps were calculated from the simple cell responses shown in a. On the right is shown the direction-tuning curve for the same neuron in response to a long bar moving in a direction perpendicular to its orientation. c, Space–time map computed from the maps shown in a (left), along with a simulated Δs–Δτ map computed from the displacement maps shown in b (right).

