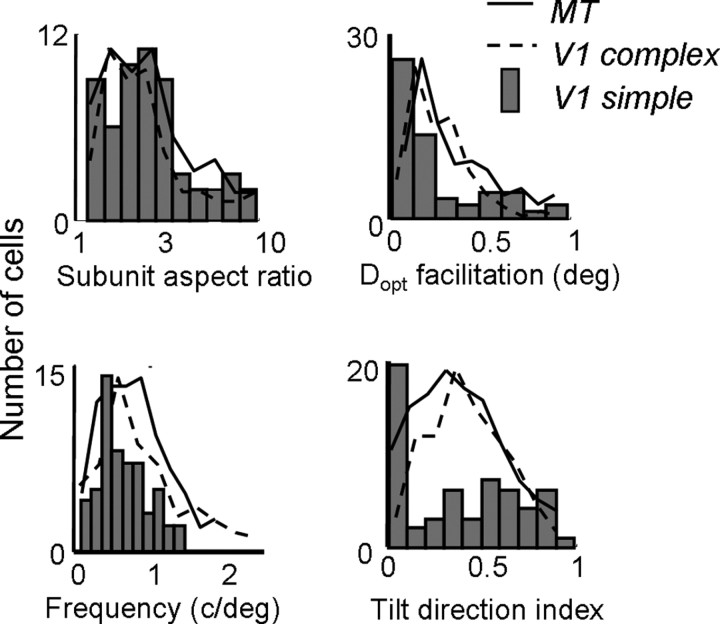
Figure 14.
Population histograms for second-order kernels derived from first-order responses of V1 simple cells. The histograms show subunit aspect ratio (top left), Dopt for facilitation (top right), Gabor frequency (bottom left), and tilt direction index (bottom right) for the simulated interaction kernels. The same values for MT (solid lines) and V1 (dashed lines) are superimposed on each histogram.

