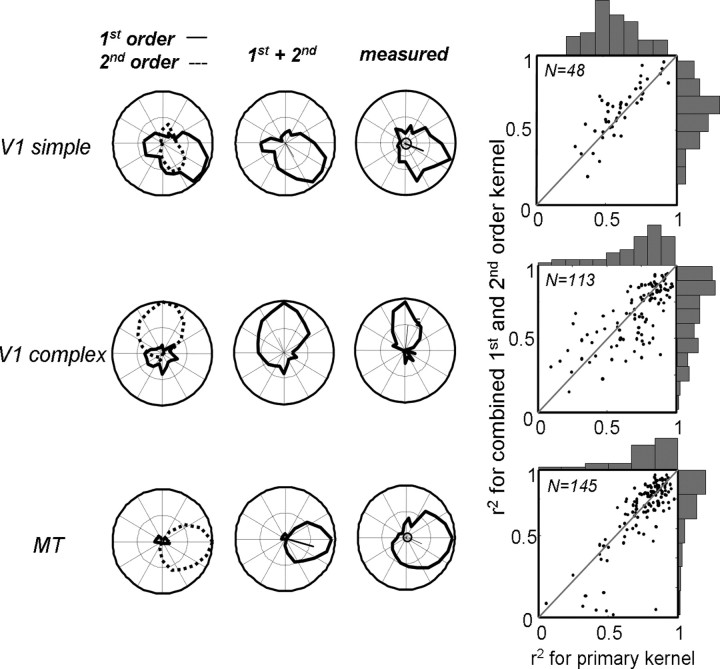
Figure 15.
Predictions of full first- and second-order kernels. The first row shows an example V1 simple cell, along with its predicted first-order (solid line) and second-order (dotted line) direction-tuning curves. The combined tuning curve is shown in the second column, and the tuning curve measured with drifting random-dot fields is shown in the third column. The extent to which the primary kernel (first-order) and combined first- and second-order kernels capture the measured tuning curve are shown as correlation coefficients in the fourth column. Rows 2 and 3 show similar data for V1 complex cells and MT cells.

