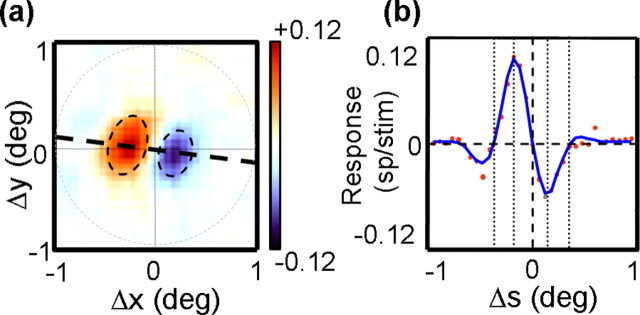
Figure 2.
a, The peak displacement map from the neuron in Figure 1a. The dashed line connects the peak of the facilitatory region to the origin of the map and is used to determine the spatial profile of the response in b. The dashed circle delineates the region over which profiles are measured. The dashed ovals show elliptical Gaussian fits to the facilitatory and suppressive response regions. b, The spatial profile of the map shown in a. Each dot corresponds to the response at one point along the profile. The solid blue curve is the Gabor fit to these points. The dashed vertical line indicates the point at which the spatial displacement (Δs) is 0. Different features of the Gabor fit are shown as dotted vertical lines, which indicate, from left to right, the zero-crossing for facilitation, the peak for facilitation, the peak for suppressive, and the zero-crossing for suppression.

