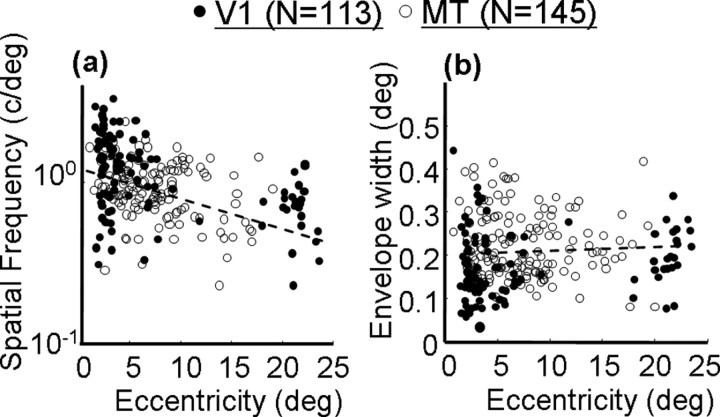
Figure 3.
Correlations between aspects of the best-fitting Gabor functions and the retinal eccentricities of the neurons. Open circles indicate V1 neurons, and filled circles indicate MT neurons. The dashed lines show the regression lines. a, Correlation between retinal eccentricity and Gabor frequency. b, Correlation between retinal eccentricity and Gabor envelope width.

