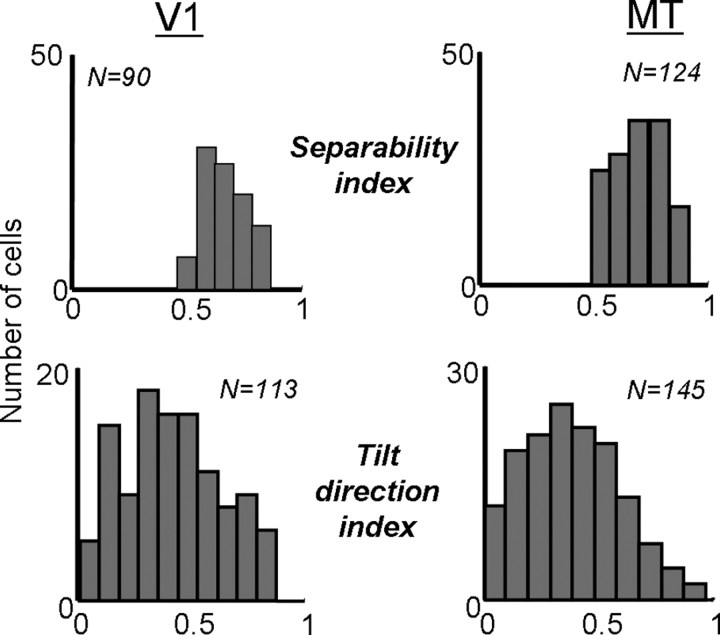
Figure 9.
Measures of separability in V1 (left) and MT (right). The top row shows population histograms of the separability index, calculated from a singular value decomposition of maps like those shown in Figure 8. The bottom row shows the tilt direction index, calculated from the discrete Fourier transform of the maps (see Materials and Methods).

