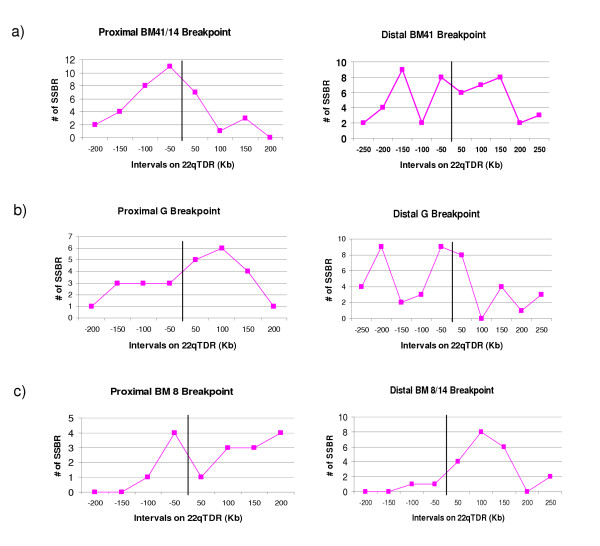
Figure 3.
Relationship between SSBR occurrence and approximate PDR breakpoint positions on 22qTDR. The x-axis marks/represents the interval on the 22qTDR in 250-200 Kb regions on both the 5' and 3' end of the PDR breakpoint (marked in the center by a vertical line). Y-axis displays the number of SSBRs present in each 50 Kb interval on x-axis.

