
Figure 2.
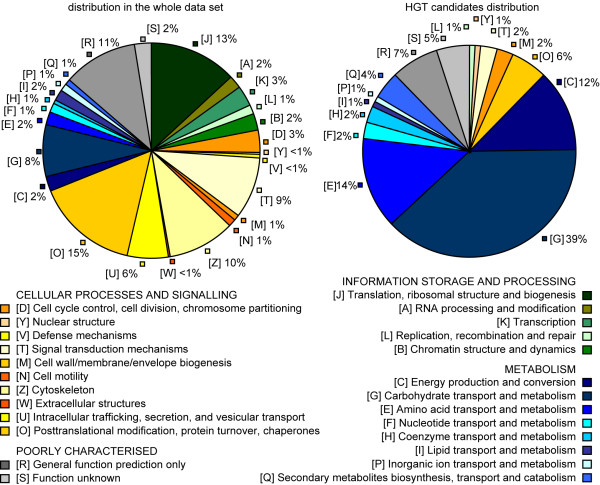
Distribution of functional classes in HGT and in the complete set of sequences. There is a clear over-representation of the metabolic KOG/COGs within the HGT candidates. green – the KOG/COG corresponding to the "information storage and processing"; yellow-orange – "cellular processes and signalling"; blue – "metabolism"; grey – "poorly characterised".