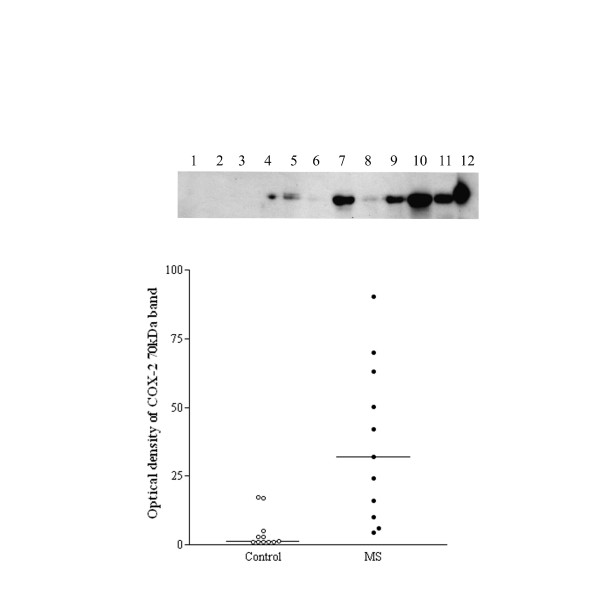
Figure 6.
Top panel, representative Western blots of the COX-2 70 kDa band in control (lanes 1–6) and MS (lanes 7 – 11), and lane 12 mouse macrophage positive control. Bottom panel, optical density analysis of COX-2 Western blots. Relative optical density readings of COX-2, 70-kDa bands in the spinal cord of controls compared to MS specimens.

