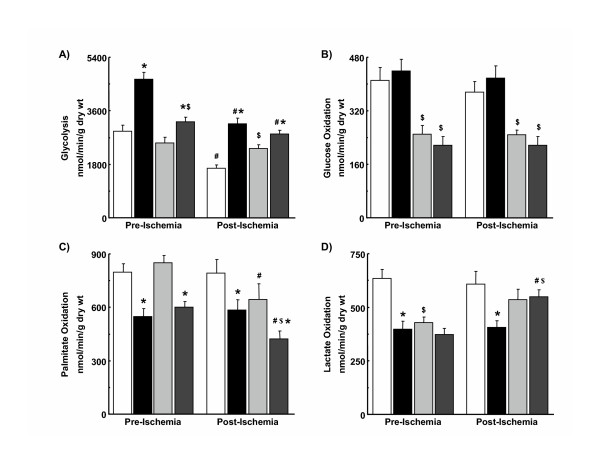
Figure 2.
Glycolysis (A), glucose oxidation (B), palmitate oxidation (C), and lactate oxidation (D) in hypertrophied and non-hypertrophied hearts from male and female rats. White bar, male non-hypertrophied hearts; black bar, male hypertrophied hearts; light grey bar, female non-hypertrophied hearts; dark grey bar, female hypertrophied hearts. *, vs. sex-matched non-hypertrophied hearts at same time period (p < 0.05). #, vs. pre-ischemic value (p < 0.05). $, vs. corresponding male hearts at same time period (p < 0.05). Numbers per group: 12 to 16 male non-hypertrophied hearts, 8 to 14 male hypertrophied hearts, and 6 to 8 female non-hypertrophied hearts, 6 to 8 female hypertrophied hearts. Values are mean ± SEM.

