
Figure 1.
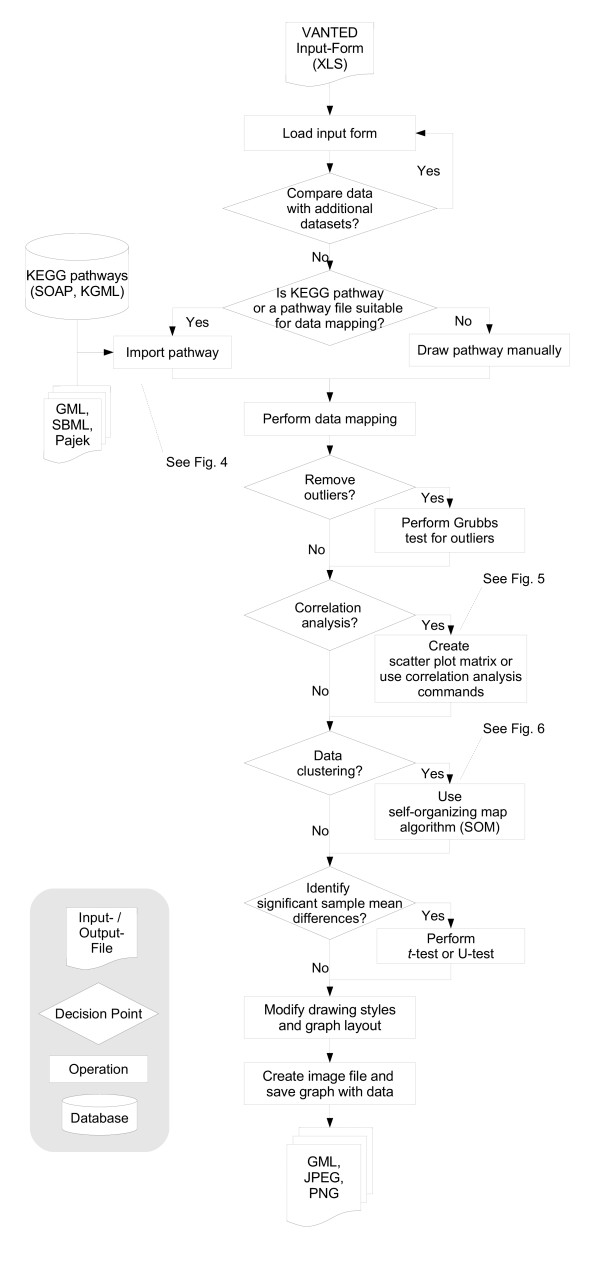
Work-flow of a typical session in VANTED. The pipeline for the visualization and analysis of biochemical data in the context of their underlying networks with VANTED. See Results section (Summary of VANTED's Features) for a detailed description.