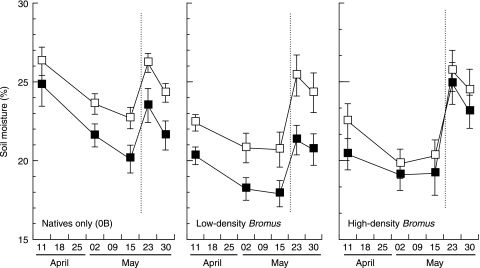
Fig. 4.
Influence of Bromus and clipping on soil moisture (percentage) in the top 30-cm of soil, from 11 April to 30 May 2002. Closed symbols = without clipping, open symbols = with clipping. Little precipitation occurred after 23 March until a late storm contributed 1.7 cm on 20–21 May (dotted line). Values are mean ± SEM.

