Fig. 5.
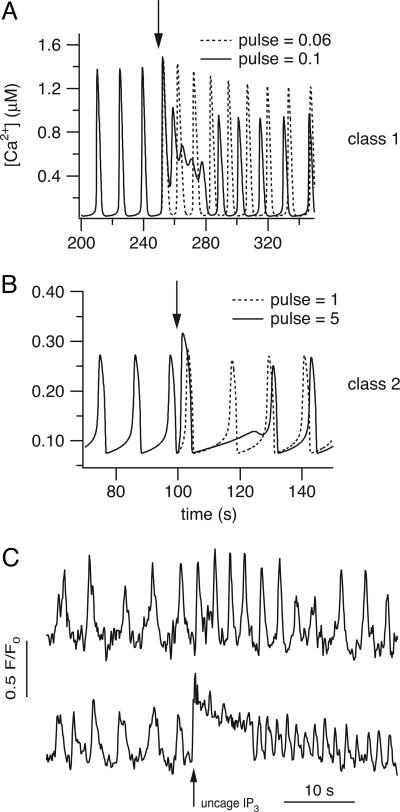
Model and experimental responses to IP3 pulses of increasing magnitude. (A) In class 1 models, an increase in the strength of the IP3 pulse causes oscillations of greater frequency and smaller amplitude, superimposed on a raised baseline. If the pulse is large enough, the oscillations can disappear entirely, leaving only the raised baseline (traces calculated from the Li–Rinzel model). (B) In class 2 models, an increase in the strength of the IP3 flash leads to a greater phase delay (traces calculated from the Atri model). (C) In ASM, an increase in the strength of the IP3 pulse leads to fast oscillations superimposed on a raised baseline, as in class 1 models. C Upper was with a smaller light flash, and thus a smaller IP3 release than in C Lower. The responses of all four cells (from two different animals) were qualitatively similar.

