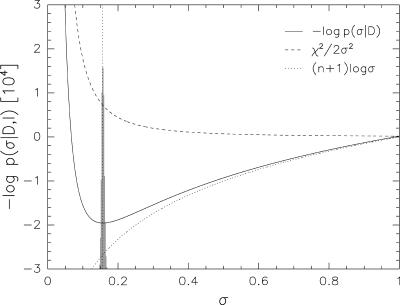
Fig. 2.
Contributions in the joint hybrid energy Ejoint(X, σ) that determine the error. The black solid curve indicates the overall dependence on the error. The dashed line shows the dependence on the term χ2/2σ2, which appears in the standard hybrid energy; the dotted line is the contribution from the regularizer log[Z(σ)/π(σ)]. The shaded histogram is the result of a Bayesian analysis (also shown in Fig. 1 for wdata = 1/σ2) and is peaked about the optimal value (vertical dotted line).

