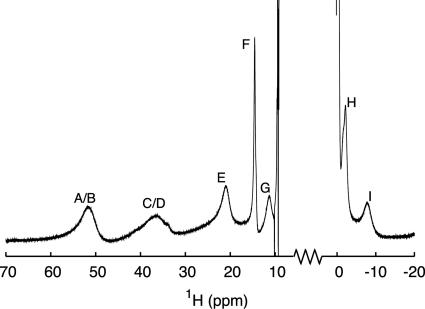
Fig. 3.
A 1H signal eliminating relaxation filter spectrum showing the hyperfine shifted signals in oxidized A.v. plastocyanin. The spectrum was recorded at 800 MHz by using the following parameters: R1o = 50 s−1, R1S = 2s−1, ta (Δ0) = 90 ms, ζ = 1, and τ = 91 ms. The assignment is (22): His-92 Hδ2 (A), His-39 Hδ2 (B), His-92 Hε1 (C), His-39 Hε1 (D), Met-97 Hγ2 (E), Asn-40 Hα (F), Met-97 Hγ1 (G), His-39 Hβ1 (H), and Cys-89 Hα (I). The spectrum is in good agreement with those of other plastocyanins (22), indicating a close similarity of the metal site structures.

