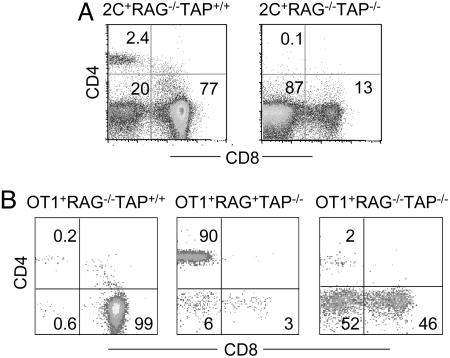
Fig. 3.
Development of CD4+ T cells in 2C+RAG−/− mice (A) and OT-1+RAG−/− mice (B). (A) PBMC from 2C+RAG−/−TAP+/+ and 2C+RAG−/−TAP−/− mice were analyzed for 2C TCR, CD4, and CD8 expression. CD4 versus CD8 expression profiles are shown for 2C+ T cells. (B) PBMC of OT-1+RAG−/−TAP+/+, OT-1+RAG+TAP−/−, and OT-1+RAG−/−TAP−/− mice were stained with anti-Vα2, anti-CD4, and anti-CD8. CD4 versus CD8 expression profiles are shown for Vα2+ T cells. The numbers indicate the percentages of T cells in the specific quadrants. Data from representative mice are shown.

